

How about displaying your data on a beautiful chart? They are very much favoured by almost all users and makes your website very appealing.
We will be creating the application from scratch but, if in case, you need this in your existing application then feel free to jump ahead. I will be listing down the steps and you should be good to go just by simple copy and paste. But, before that there are some prerequisites in order to continue.
NodeJS installed.
Angular CLI installed.
Create a new angular project. I will be using angular 8 here but this should work for any angular application above verison 2.
ng new chartjs-demo
If you are prompted with a configuration selection screen then you can select accordingly. However, I will be keeping everything as default.
Open the newly created project (chartsjs-demo in my case) in your favorite code editor.
For Angular2+ the equivalence library for ChartsJS is Ng2Charts and here we will be using the same. I will also be referring the Ng2Charts documentation for installing and setting up the charts.
Open a terminal in your current project folder and execute the following command.
 npm install --save ng2-charts
 npm install --save chart.js
The above step will install ChartJS library into your angular application. We need to import it as a module now. We do what we always do to import modules in angular. Import it in app.module.ts file.
 import { ChartsModule } from 'ng2-charts';

 // In your App's module:
 imports: [
   ChartsModule
 ]
Just to be sure we are not bombarded with errors we can check our application in the browser by running ng serve -o.
A starter screen should automatically open and you should be able to see angular screen.
Now, moving on to the charts part. I will be creating the charts right at the App Component. So, to do this we can remove all existing code in app.component.html and add this snippet for rendering charts.
 <div>
     <div>
         <div class="chart">
         <canvas baseChart [data]="pieChartData" [labels]="pieChartLabels"
             [chartType]="pieChartType" [options]="pieChartOptions" [colors]="pieChartColors" [legend]="pieChartLegend">
         </canvas>
         </div>
     </div>
 </div>
Similarly, in app.component.ts file you can replace the existing code with:
import { Component } from '@angular/core';
import { ChartType, ChartOptions } from 'chart.js';
import { Label } from 'ng2-charts';
@Component({
selector: 'app-root',
templateUrl: './app.component.html',
styleUrls: ['./app.component.scss']
})
export class AppComponent {
title = 'chartjs';
public pieChartOptions: ChartOptions = {
responsive: true,
legend: {
position: 'top',
},
plugins: {
datalabels: {
formatter: (value, ctx) => {
const label = ctx.chart.data.labels[ctx.dataIndex];
return label;
},
},
}
};
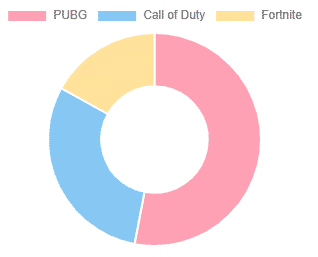
public pieChartLabels: Label[] = [['PUBG'], ['Fortnite'], ['Call of Duty']];
public pieChartData: number[] = [300, 500, 100];
public pieChartType: ChartType = 'pie';
public pieChartLegend = true;
public pieChartColors = [
{
backgroundColor: ['rgba(255,0,0,0.3)', 'rgba(0,255,0,0.3)', 'rgba(0,0,255,0.3)'],
},
];
}
Switch back to your browser and you should see something like this.
Congratutions, we are done. The charts are at your disposal.
It was easy isn’t it? But it is very rare that your requirements will be this limited and abstract.
The chart we did here is just the tip of an iceberg. There are lots of other charts like line charts, bar charts, doughnut charts and scatter plots which you could make use of. All the available charts are present in this documentation. These charts are very customizable and configurable but unfortunately not all options are available in the documentation above. For more options regarding the configurations, you might want to have a look at CHARTJS Docs. Other entities might be different but the ChartOptions are exactly the same.
The entire code for this can be found here: https://github.com/prameshbajra/chartsjs-demo
Hope this helps! Happy Coding!
As always, feel free to get in touch if you need any help.